ML analysis of Rey Complex Figure performance
Interpretable machine learning explores how education, sex, and age shape Rey Complex Figure performance.
Education, Sex, and Age Shape Rey Complex Figure Performance in Cognitively Normal Adults: An Interpretable Machine Learning Study
Journal of Clinical Medicine · 14(21), 7562
Study overview
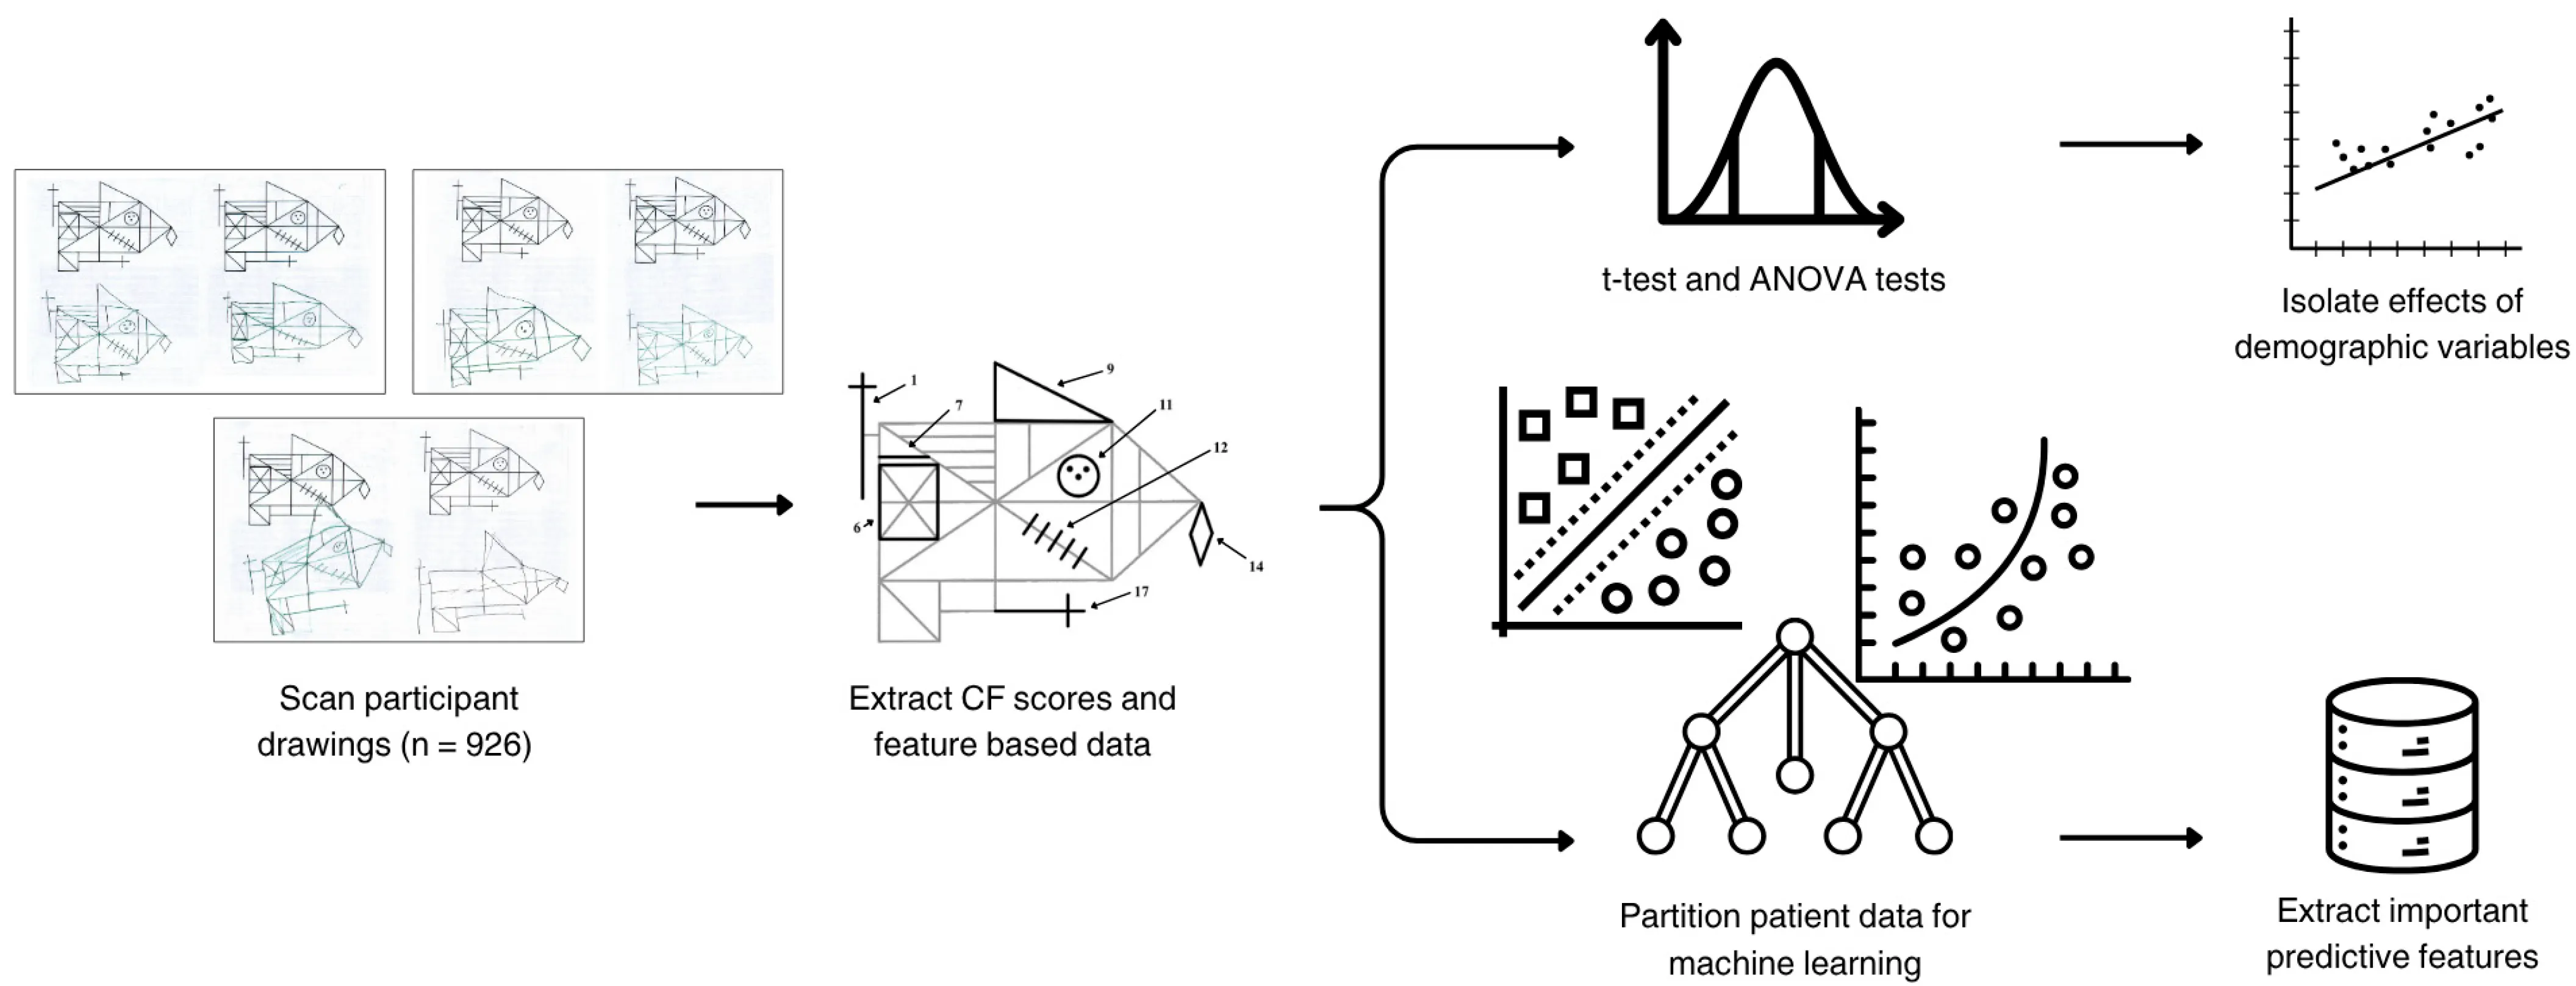
- Analyzed Complex Figure performance in 926 cognitively healthy Emory Healthy Brain Study participants, ages 45–80, with MoCA scores of at least 24.
- Combined individual drawing-element scores, totals, completion times, and MoCA measures to classify education, sex, and age using support-vector machines, logistic regression, and random forests.
Key findings
- Education was associated with copy, immediate-recall, and delayed-recall totals. Age and sex were associated with both recall totals; sex was not associated with the copy total.
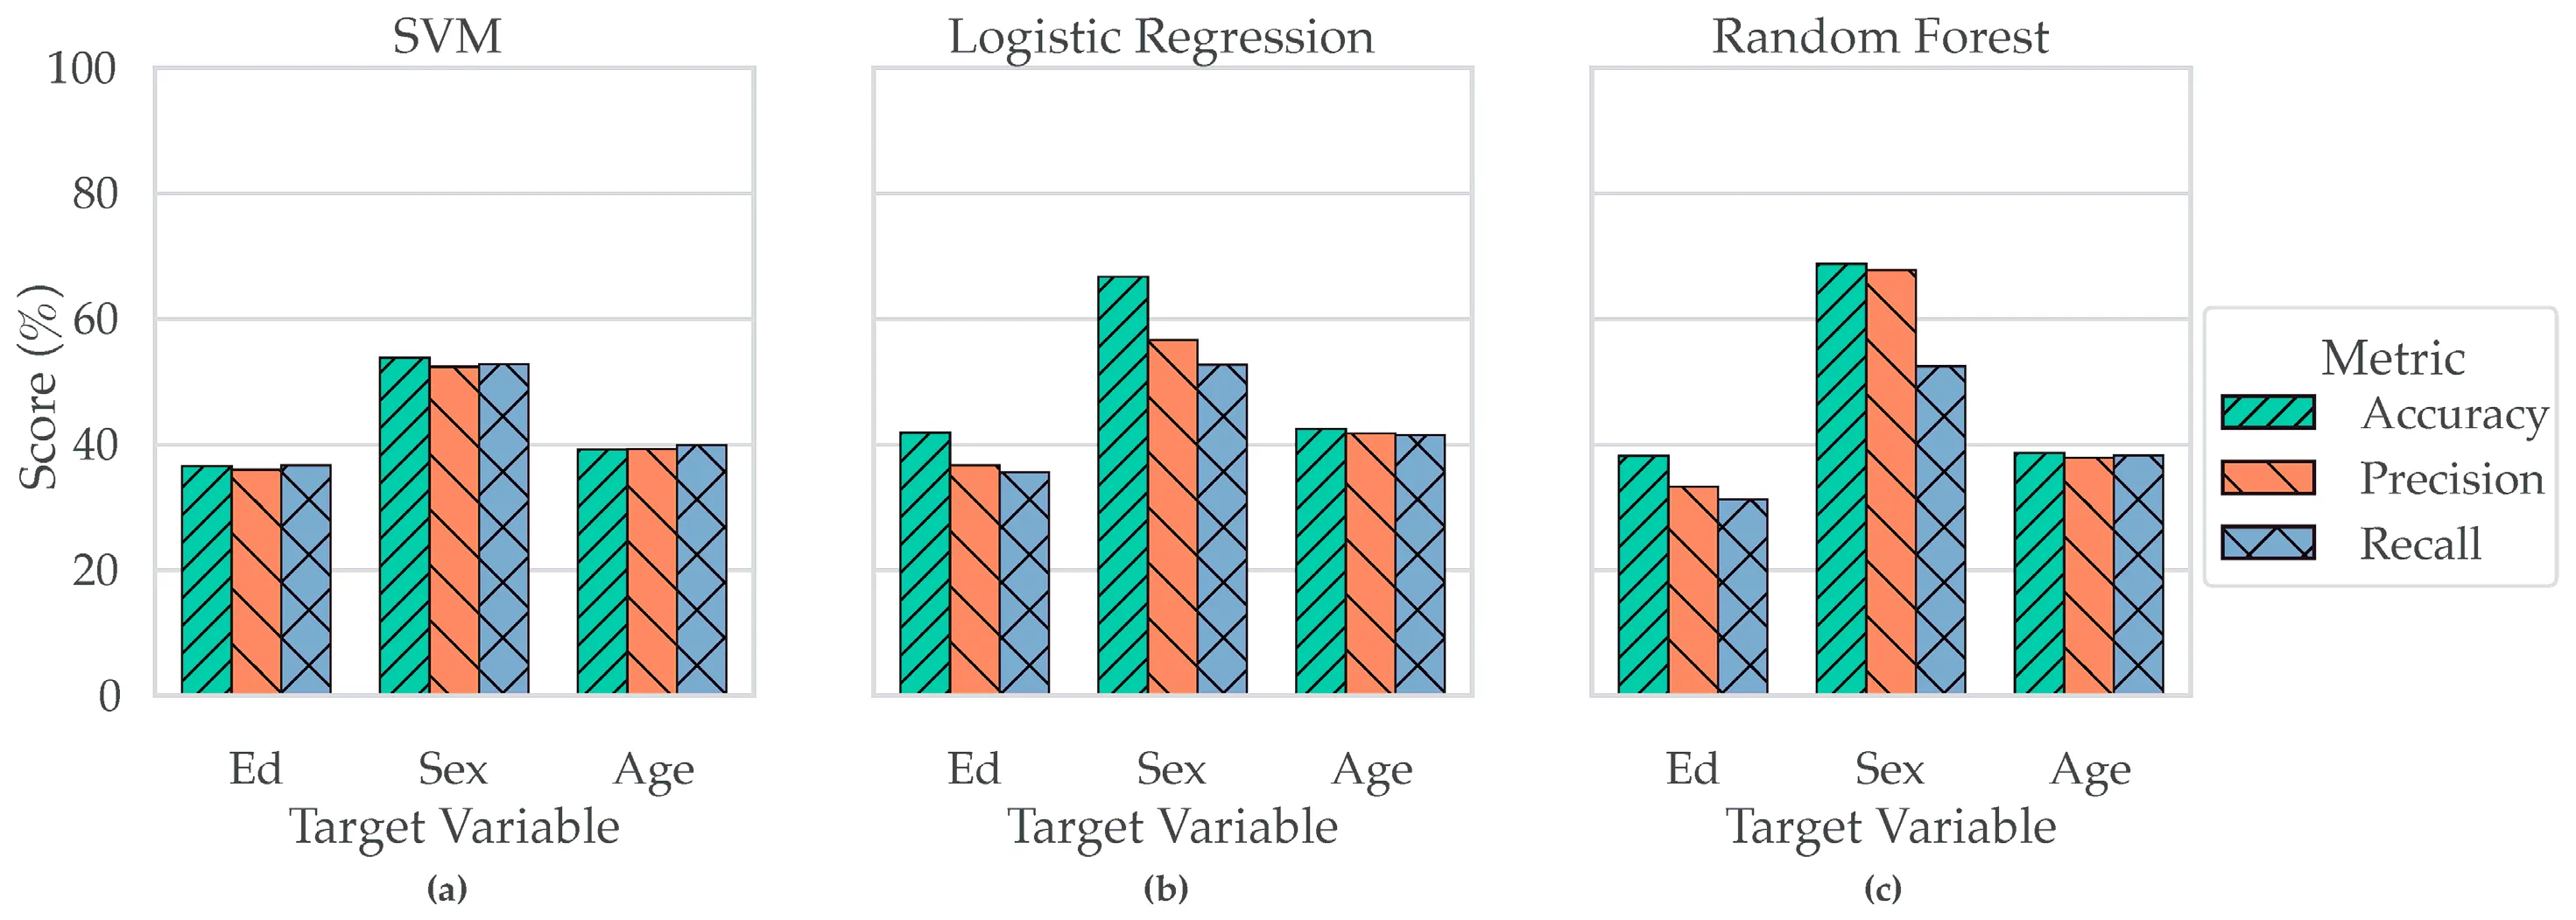
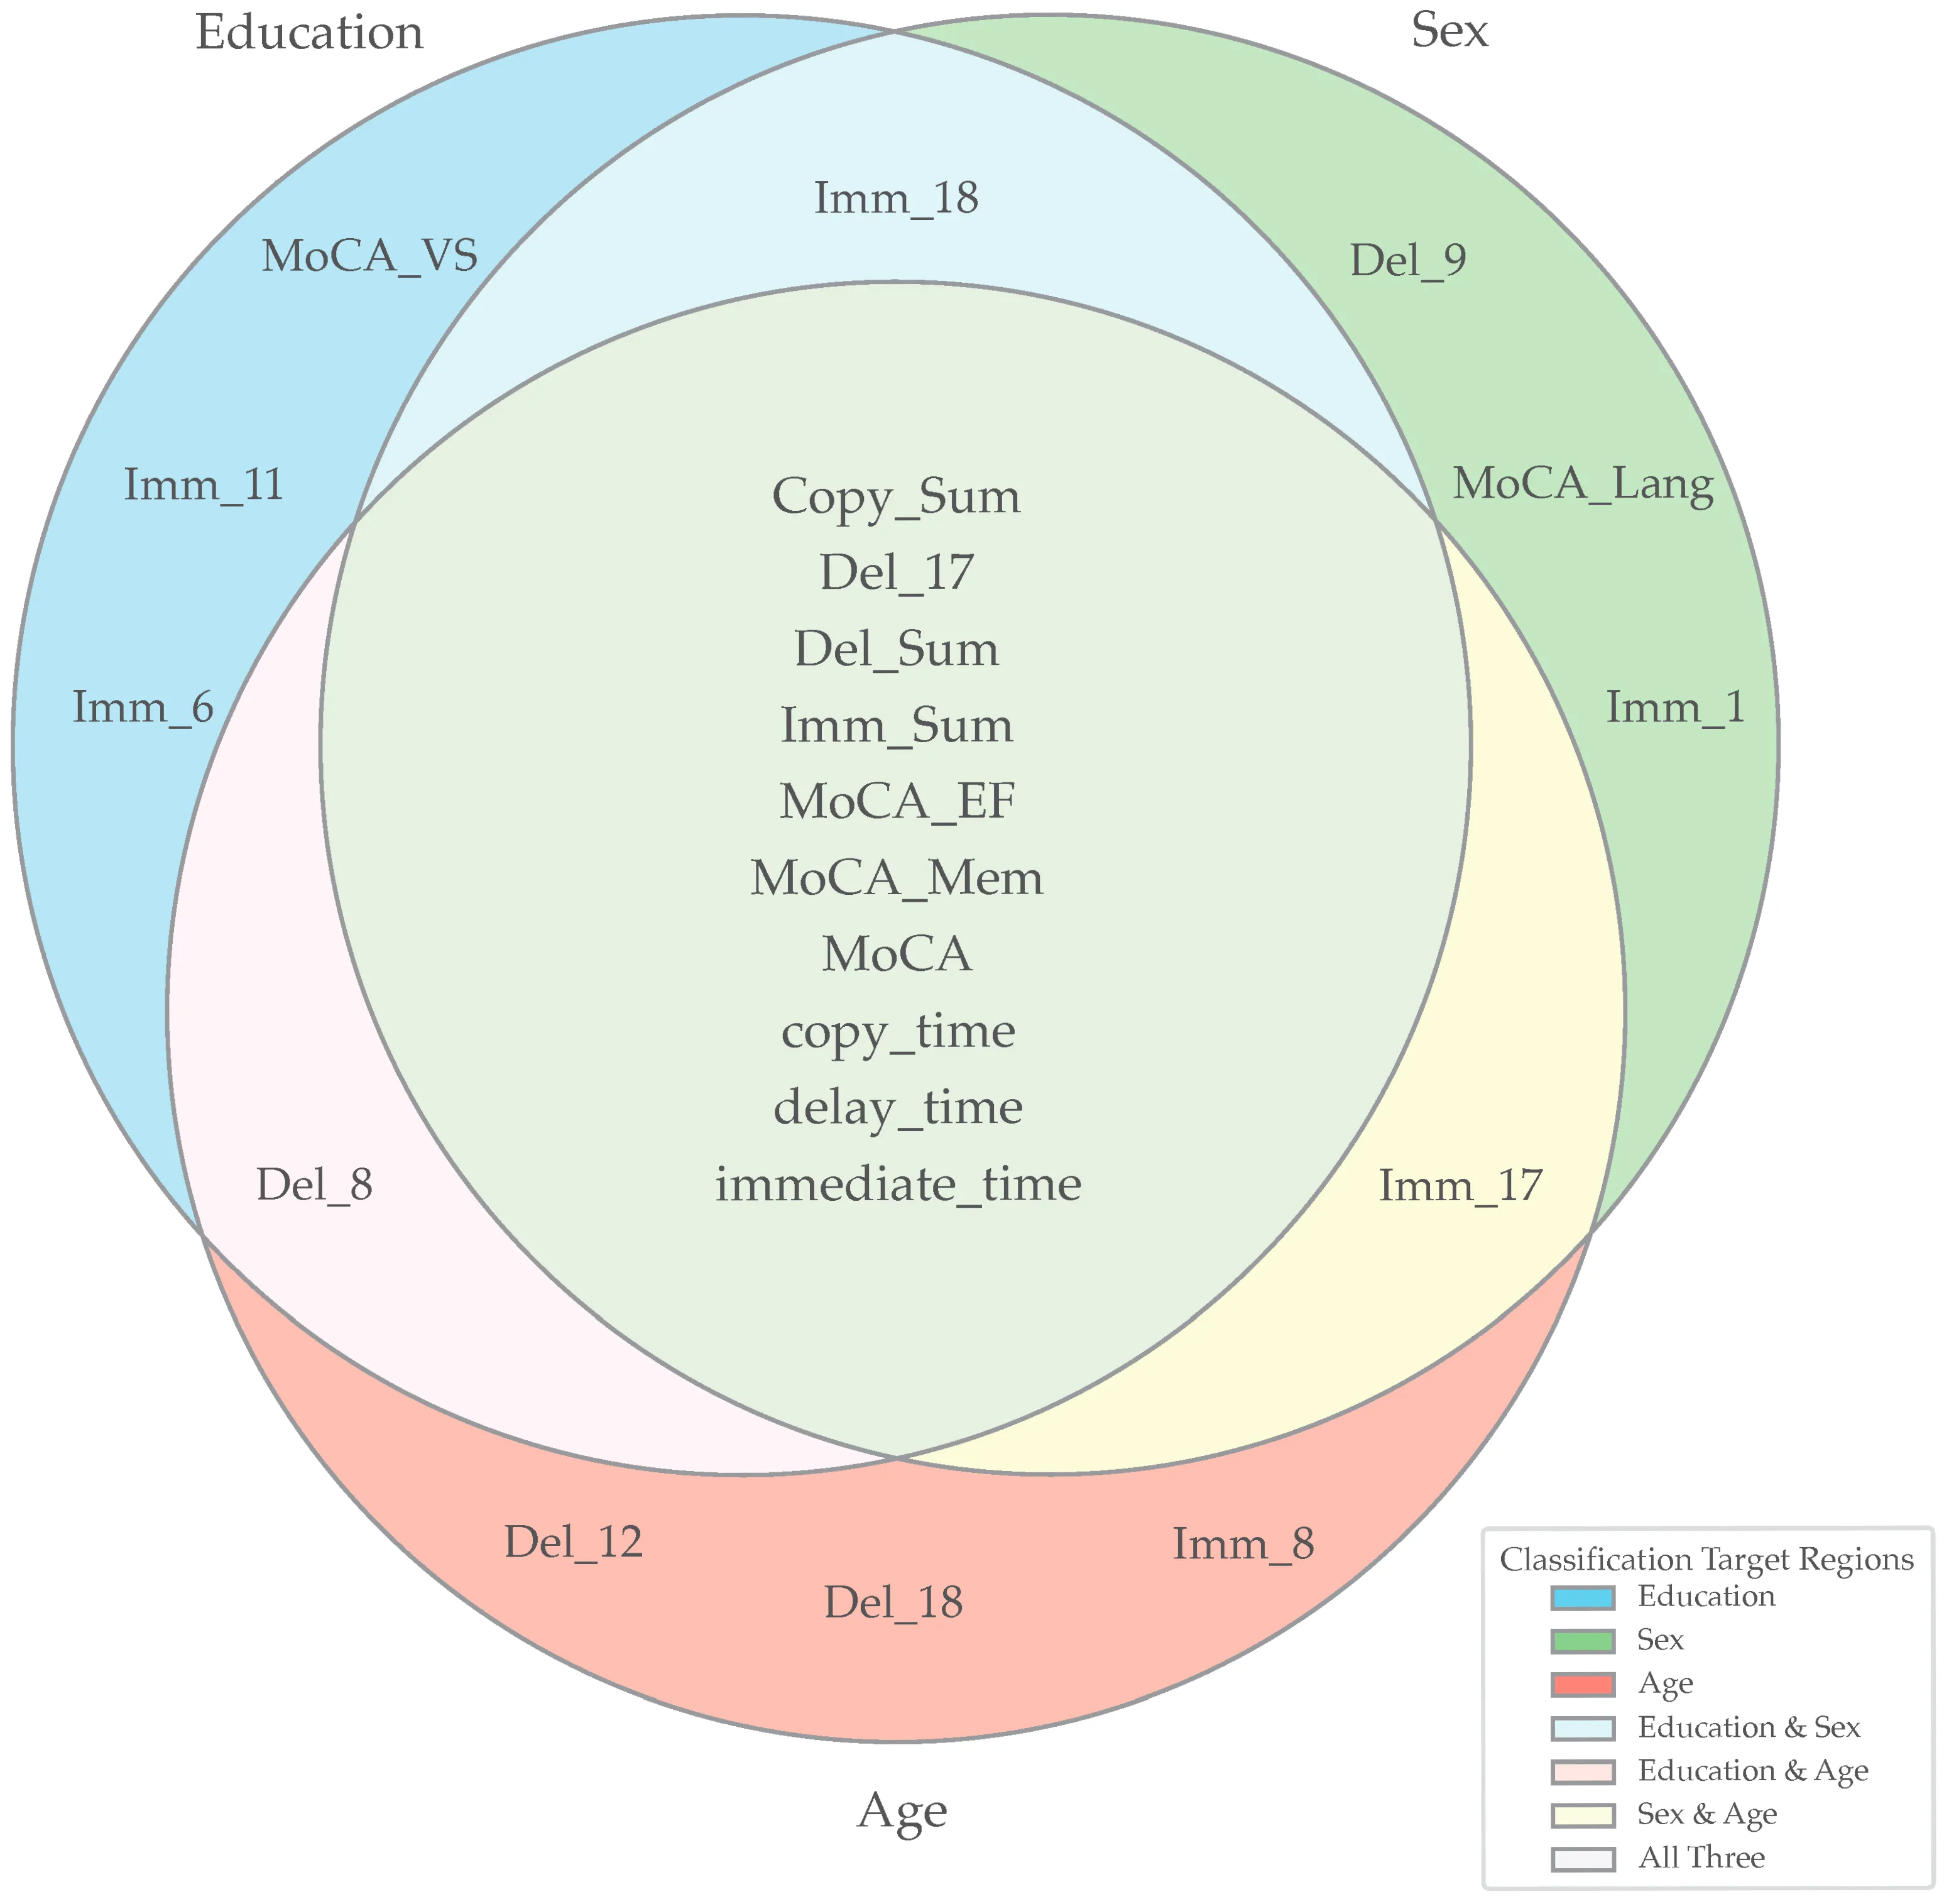
- Copy time, immediate-recall time, and MoCA were consistently important predictors. Logistic regression had the highest reported accuracy for education and age, while random forest performed best for sex.
- The cross-sectional sample was predominantly White and female, and the models had no external validation cohort. The findings describe demographic associations, not causal effects or a validated diagnostic tool.
Figures