Mapping molecular overlap of neurodegenerative diseases
Comparing the molecular pathophysiology of Alzheimer’s disease, ALS, and frontotemporal dementia with SemNet 2.0.
Artificial Intelligence-Assisted Comparative Analysis of the Overlapping Molecular Pathophysiology of Alzheimer’s Disease, Amyotrophic Lateral Sclerosis, and Frontotemporal Dementia
International Journal of Molecular Sciences · 25(24), 13450
Study overview
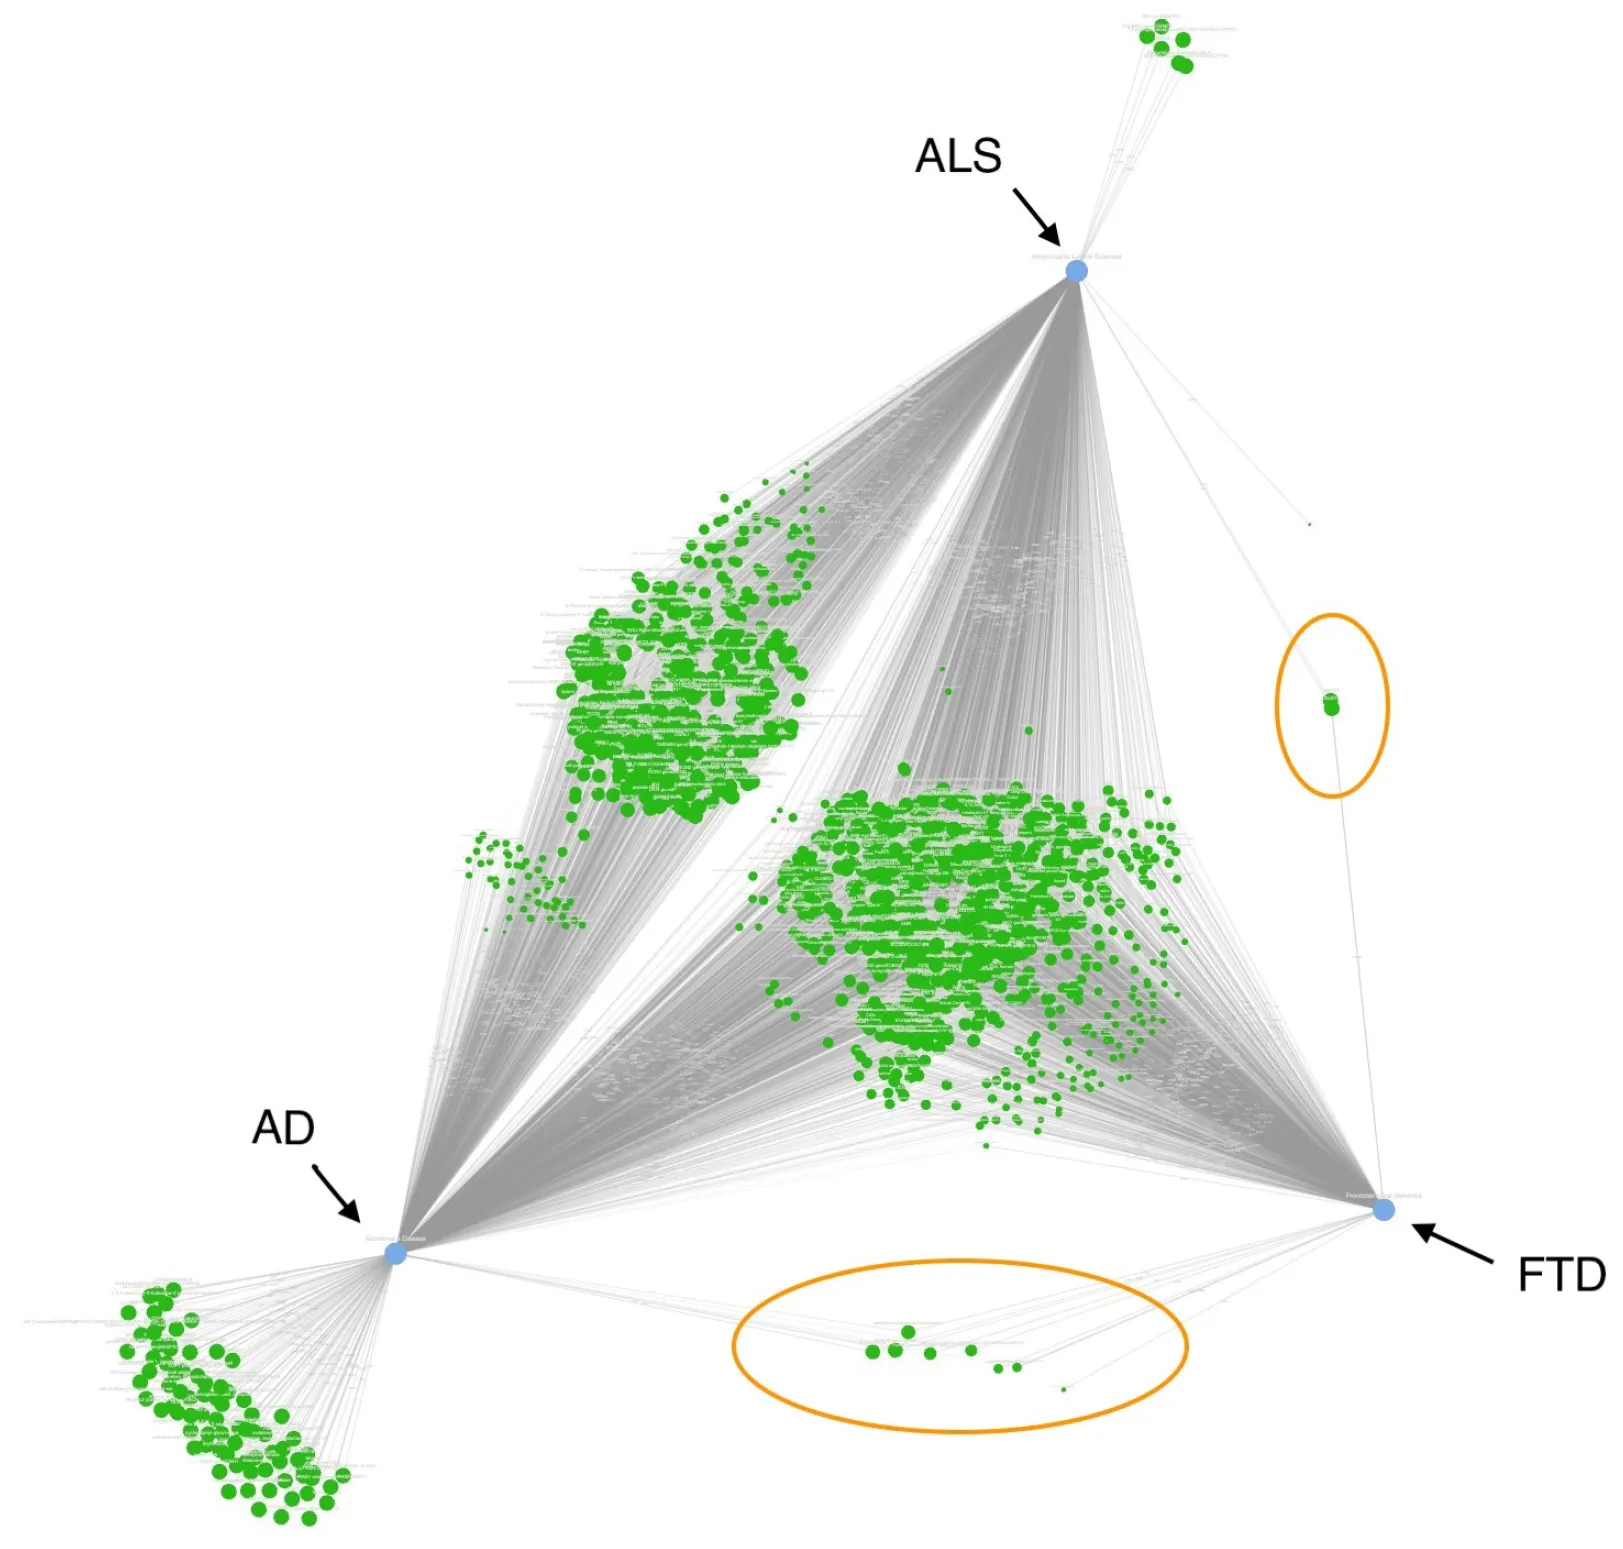
- Used SemNet 2.0 to compare amino-acid, peptide, and protein concepts associated with Alzheimer’s disease, ALS, and FTD in a knowledge graph derived from more than 33 million PubMed articles.
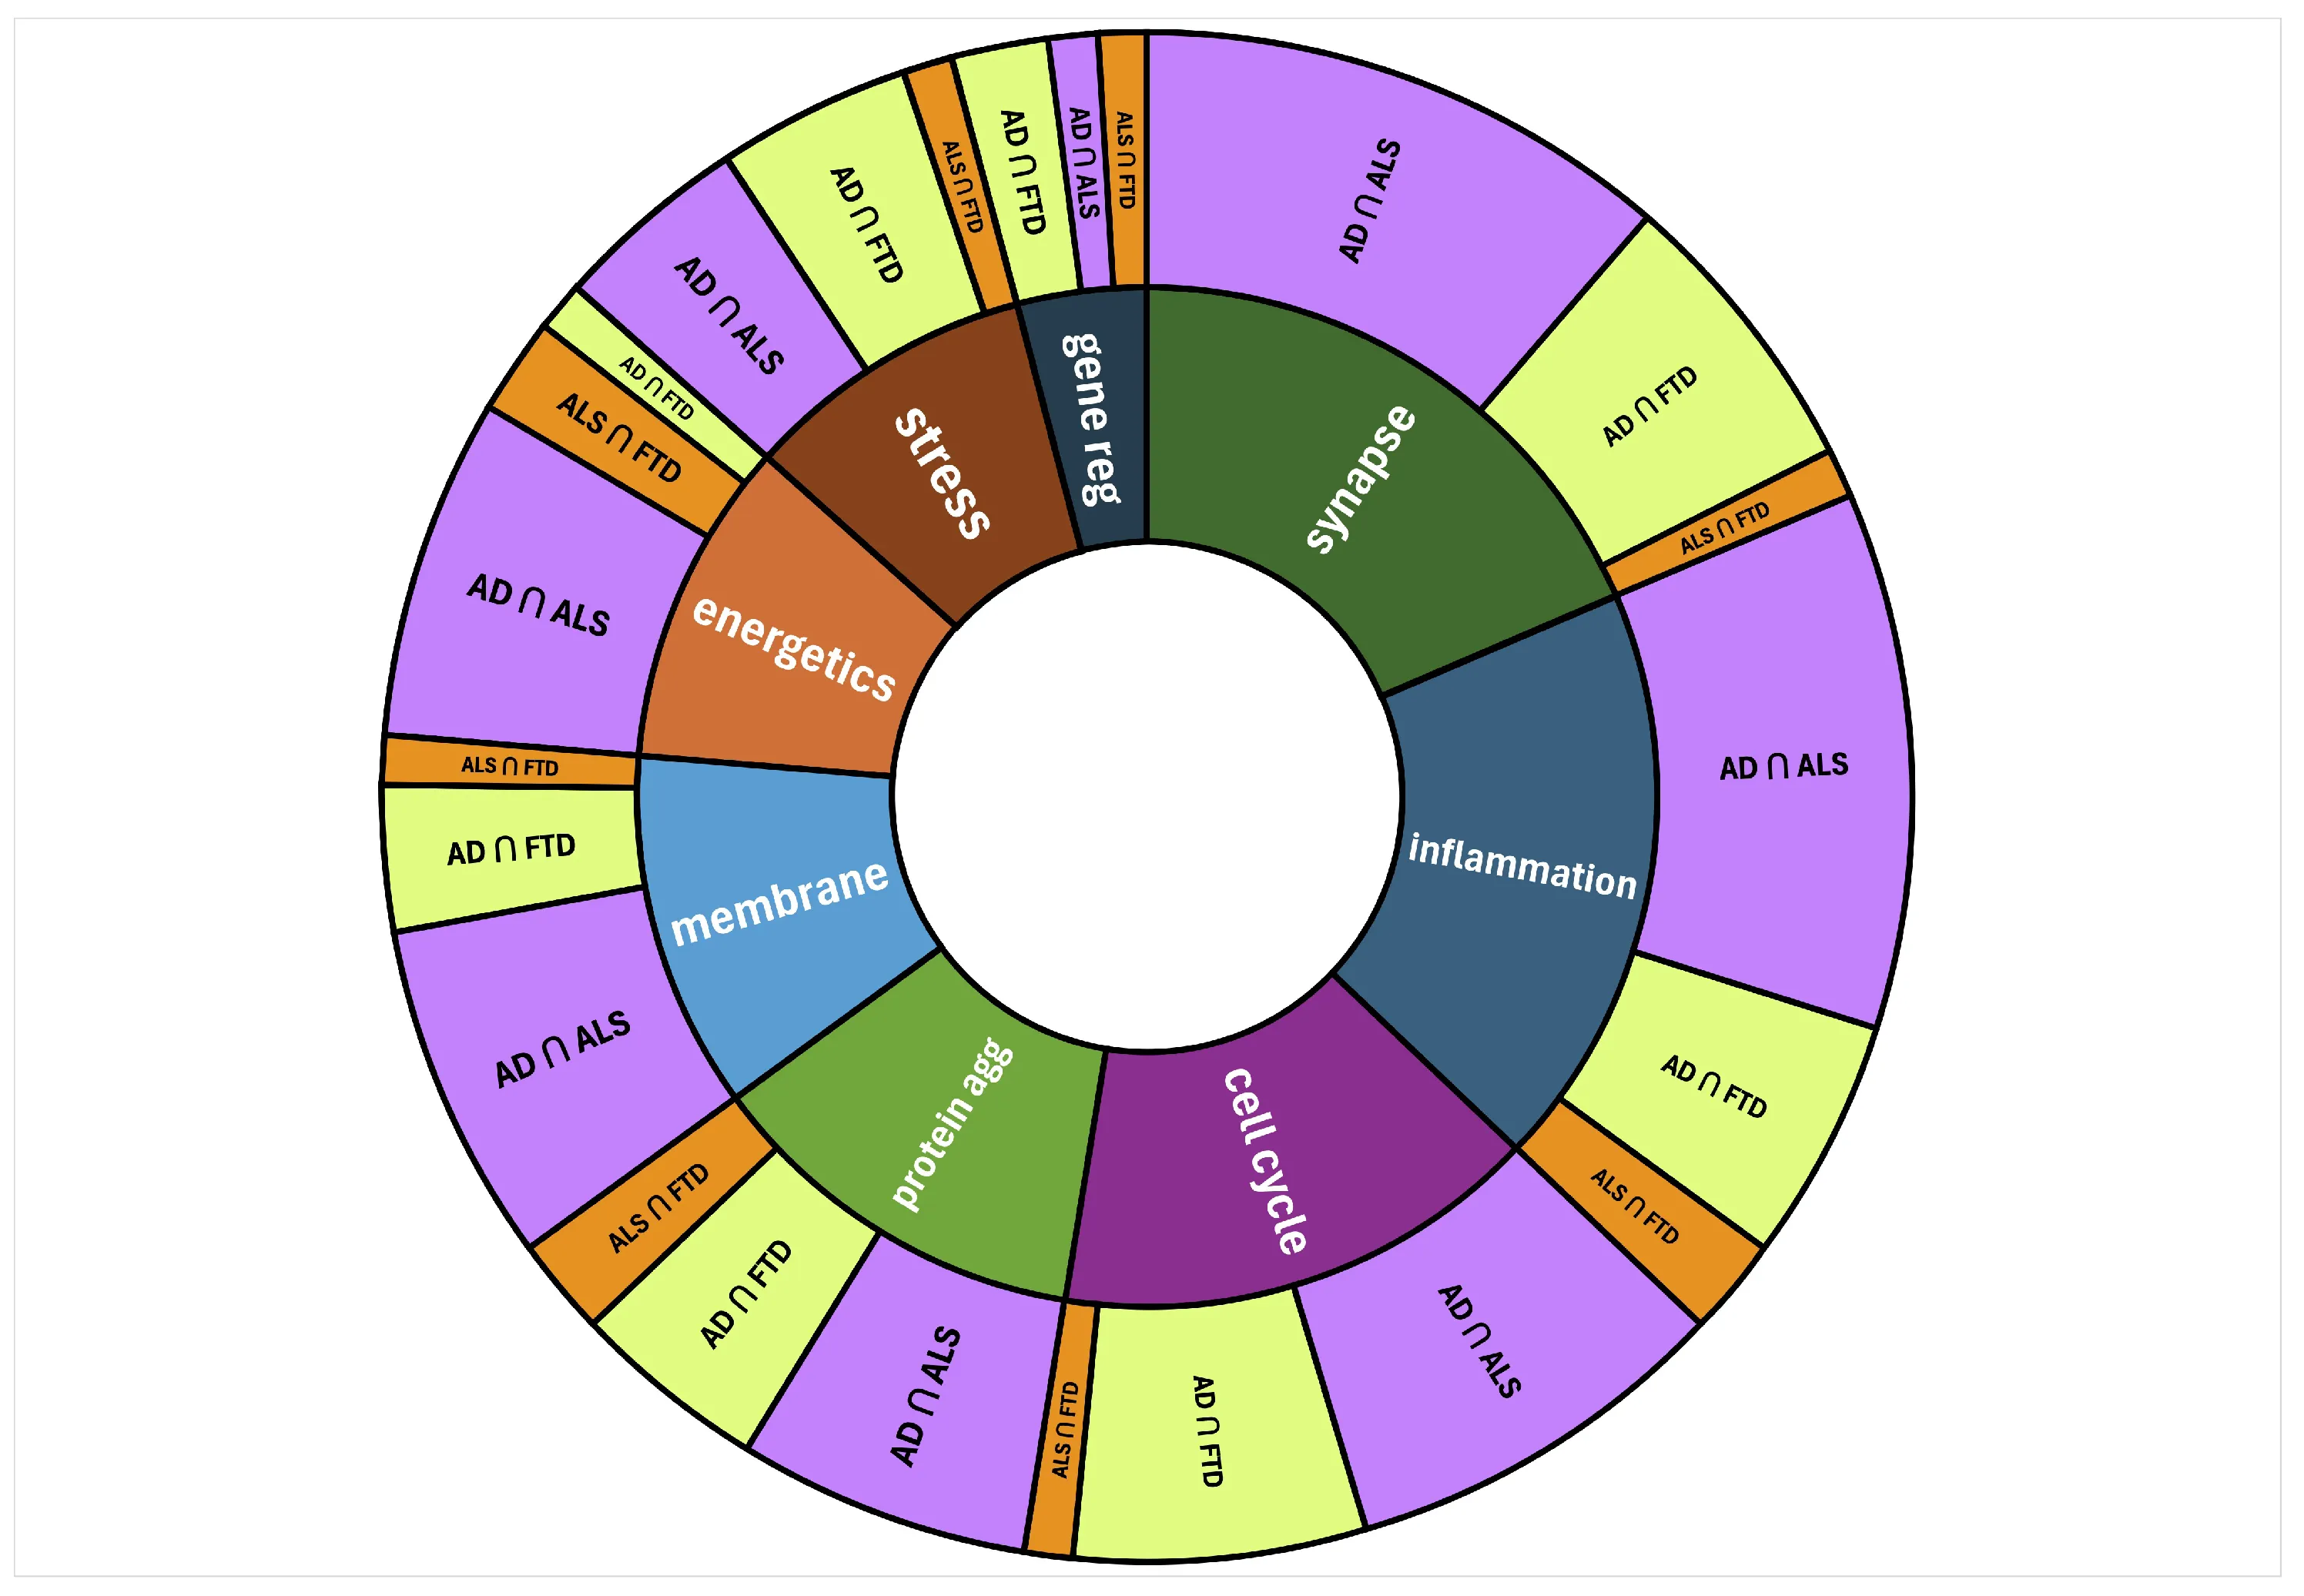
- Ranked concepts with normalized HeteSim scores and visualized overlap with CompositeView. NLP and GPT-4o mapped the top-ranked 1% to eight biological processes, with three trained reviewers checking supporting evidence.
Key findings
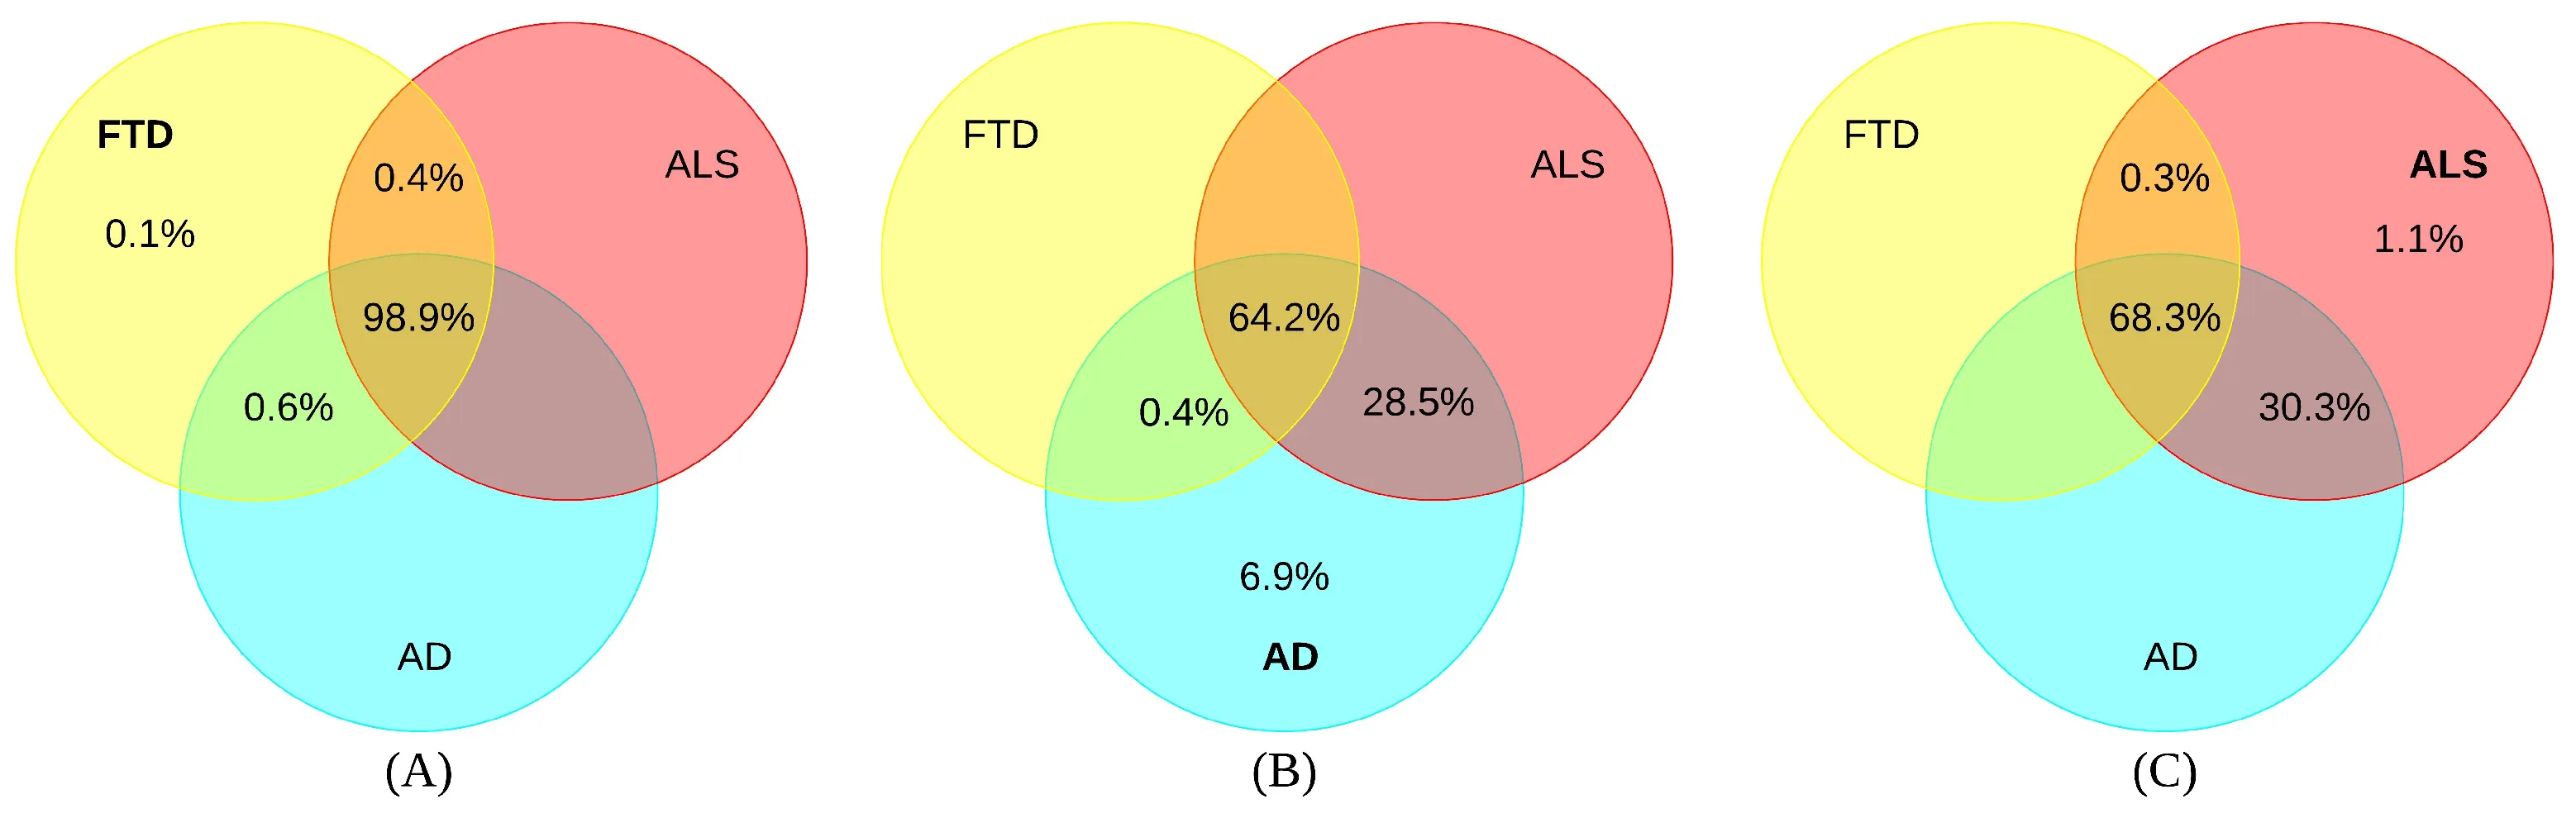
- FTD shared 99.9% of its retrieved molecular nodes with Alzheimer’s disease and/or ALS—a measure of literature-derived graph overlap, not patient-level disease equivalence.
- Inflammation/immune response and synapse/neurotransmission each accounted for 19% of mapped intersections, followed by cell-cycle regulation at 15% and protein aggregation at 12%.
- Publication and ontology biases can influence these associations. The proposed disease spectrum and regulatory explanations remain hypotheses requiring experimental or clinical validation.
Figures