Multimorbidity study across neurodegenerative diseases
An AI-driven study of multimorbidity across Alzheimer’s disease, ALS, and frontotemporal dementia.
An Artificial Intelligence-Driven Multimorbidity Framework Reveals a Shared Metabolic and Immune Core Across Alzheimer’s Disease, Amyotrophic Lateral Sclerosis, and Frontotemporal Dementia
Biomedicines · 14(2), 444
Study overview
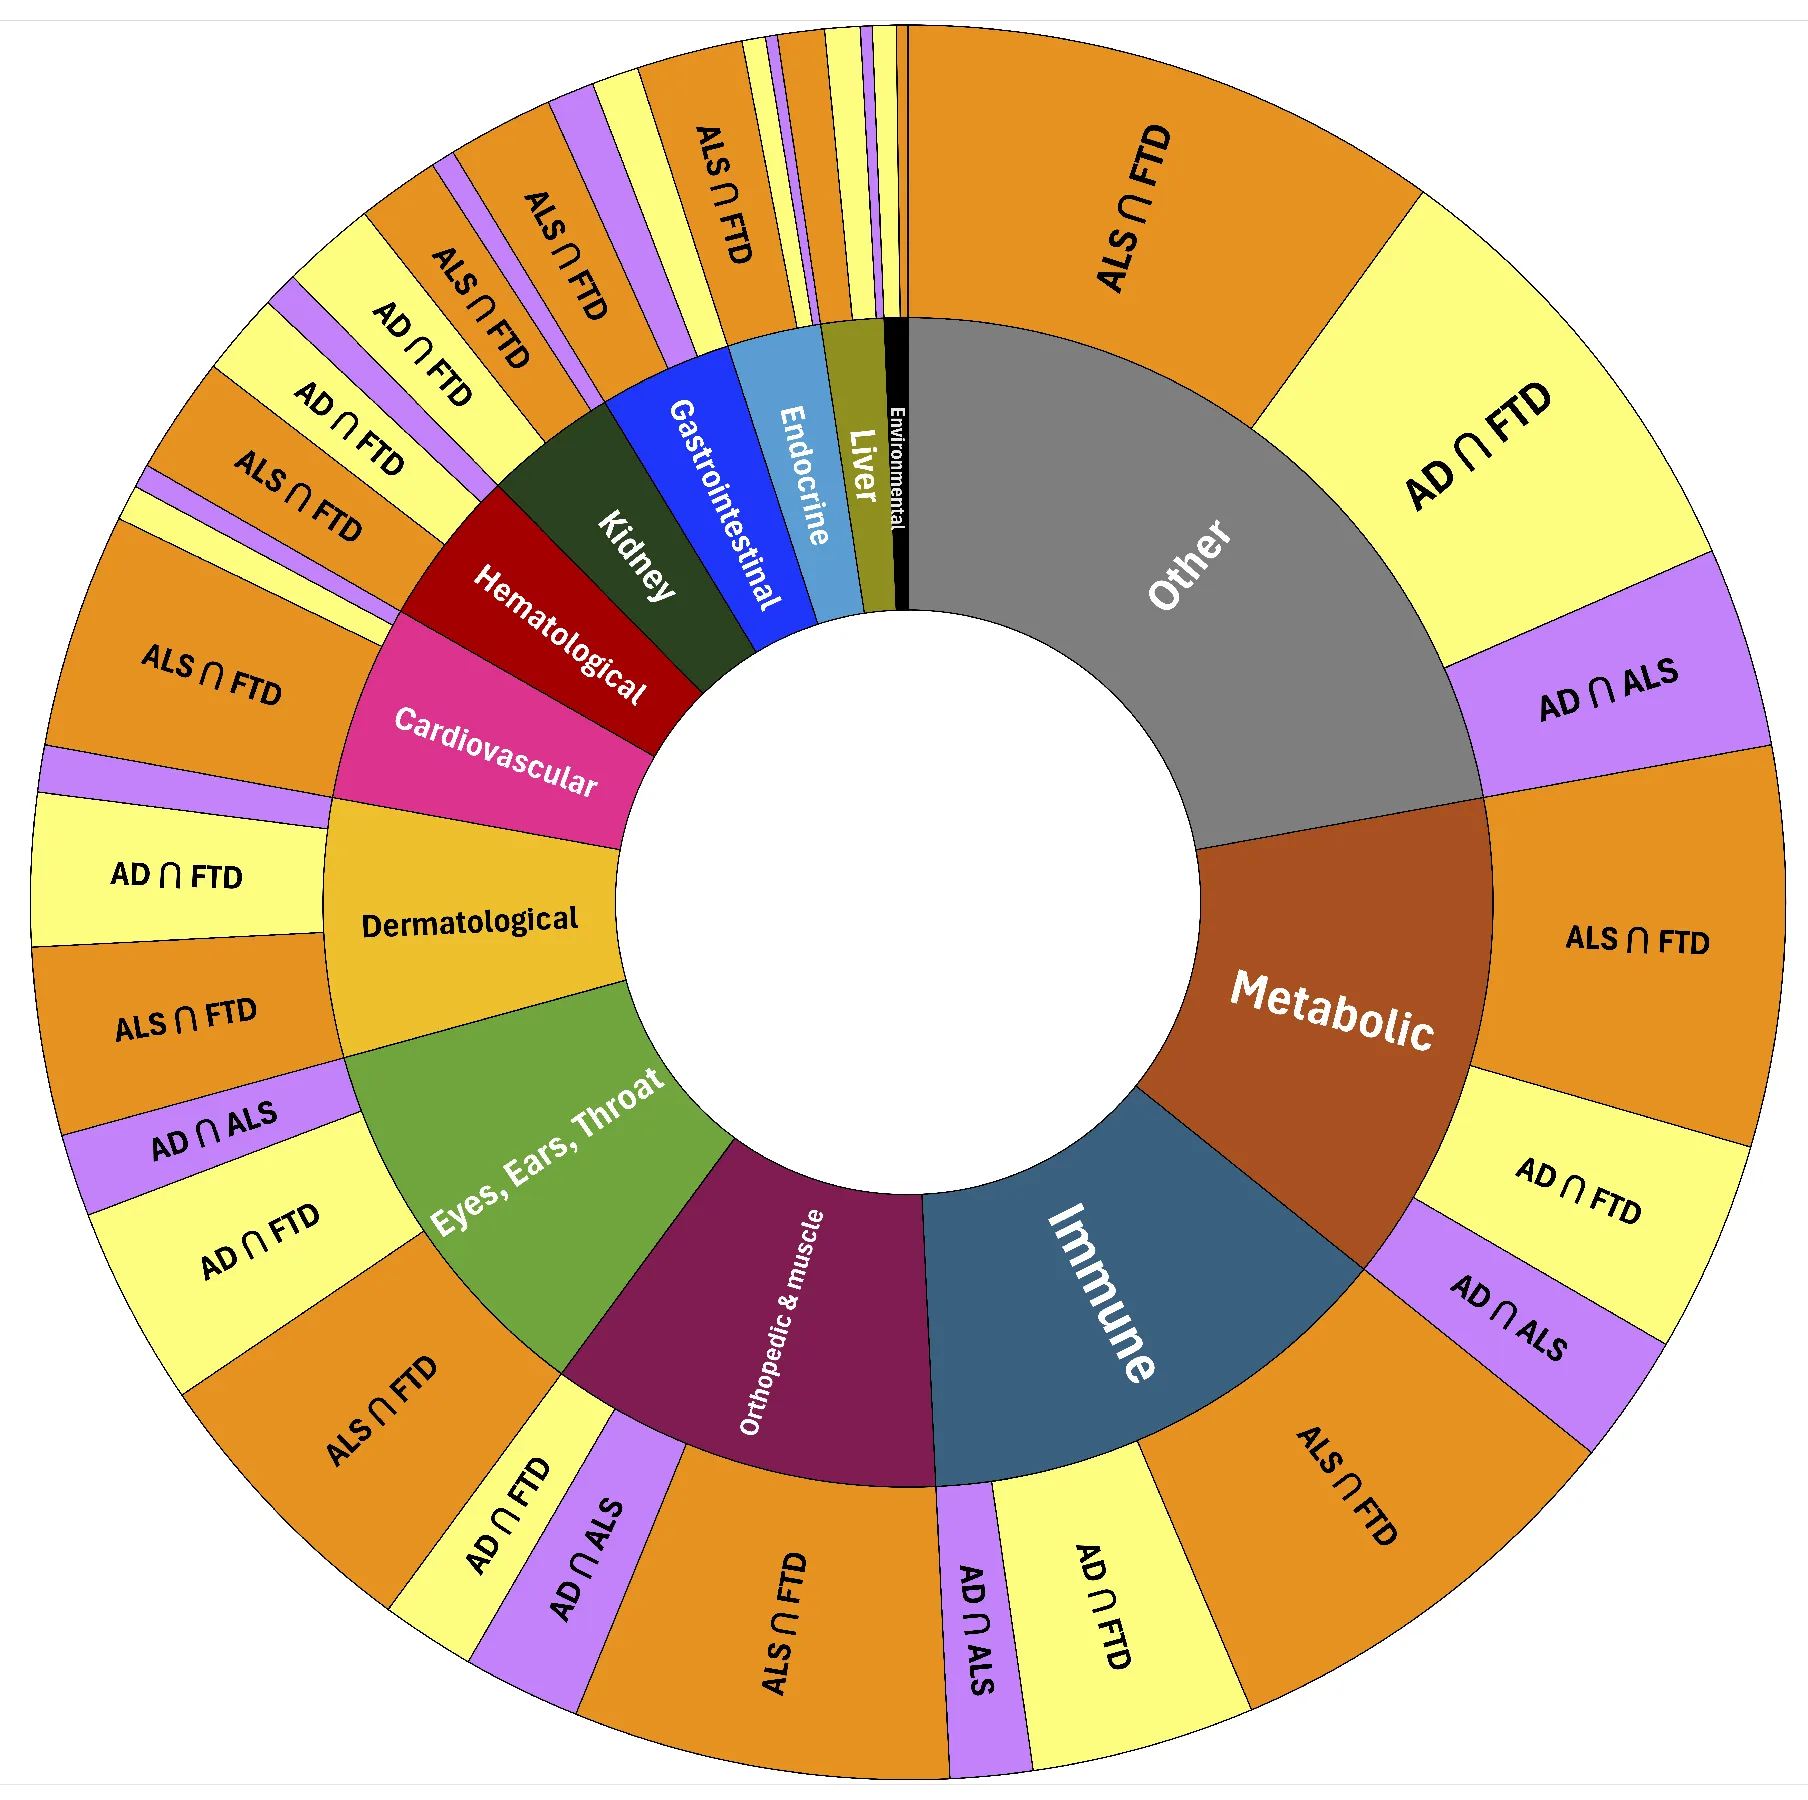
- Used SemNet 2.0, built from more than 35 million PubMed abstracts, to rank disease, syndrome, and drug concepts associated with Alzheimer’s disease, ALS, and frontotemporal dementia.
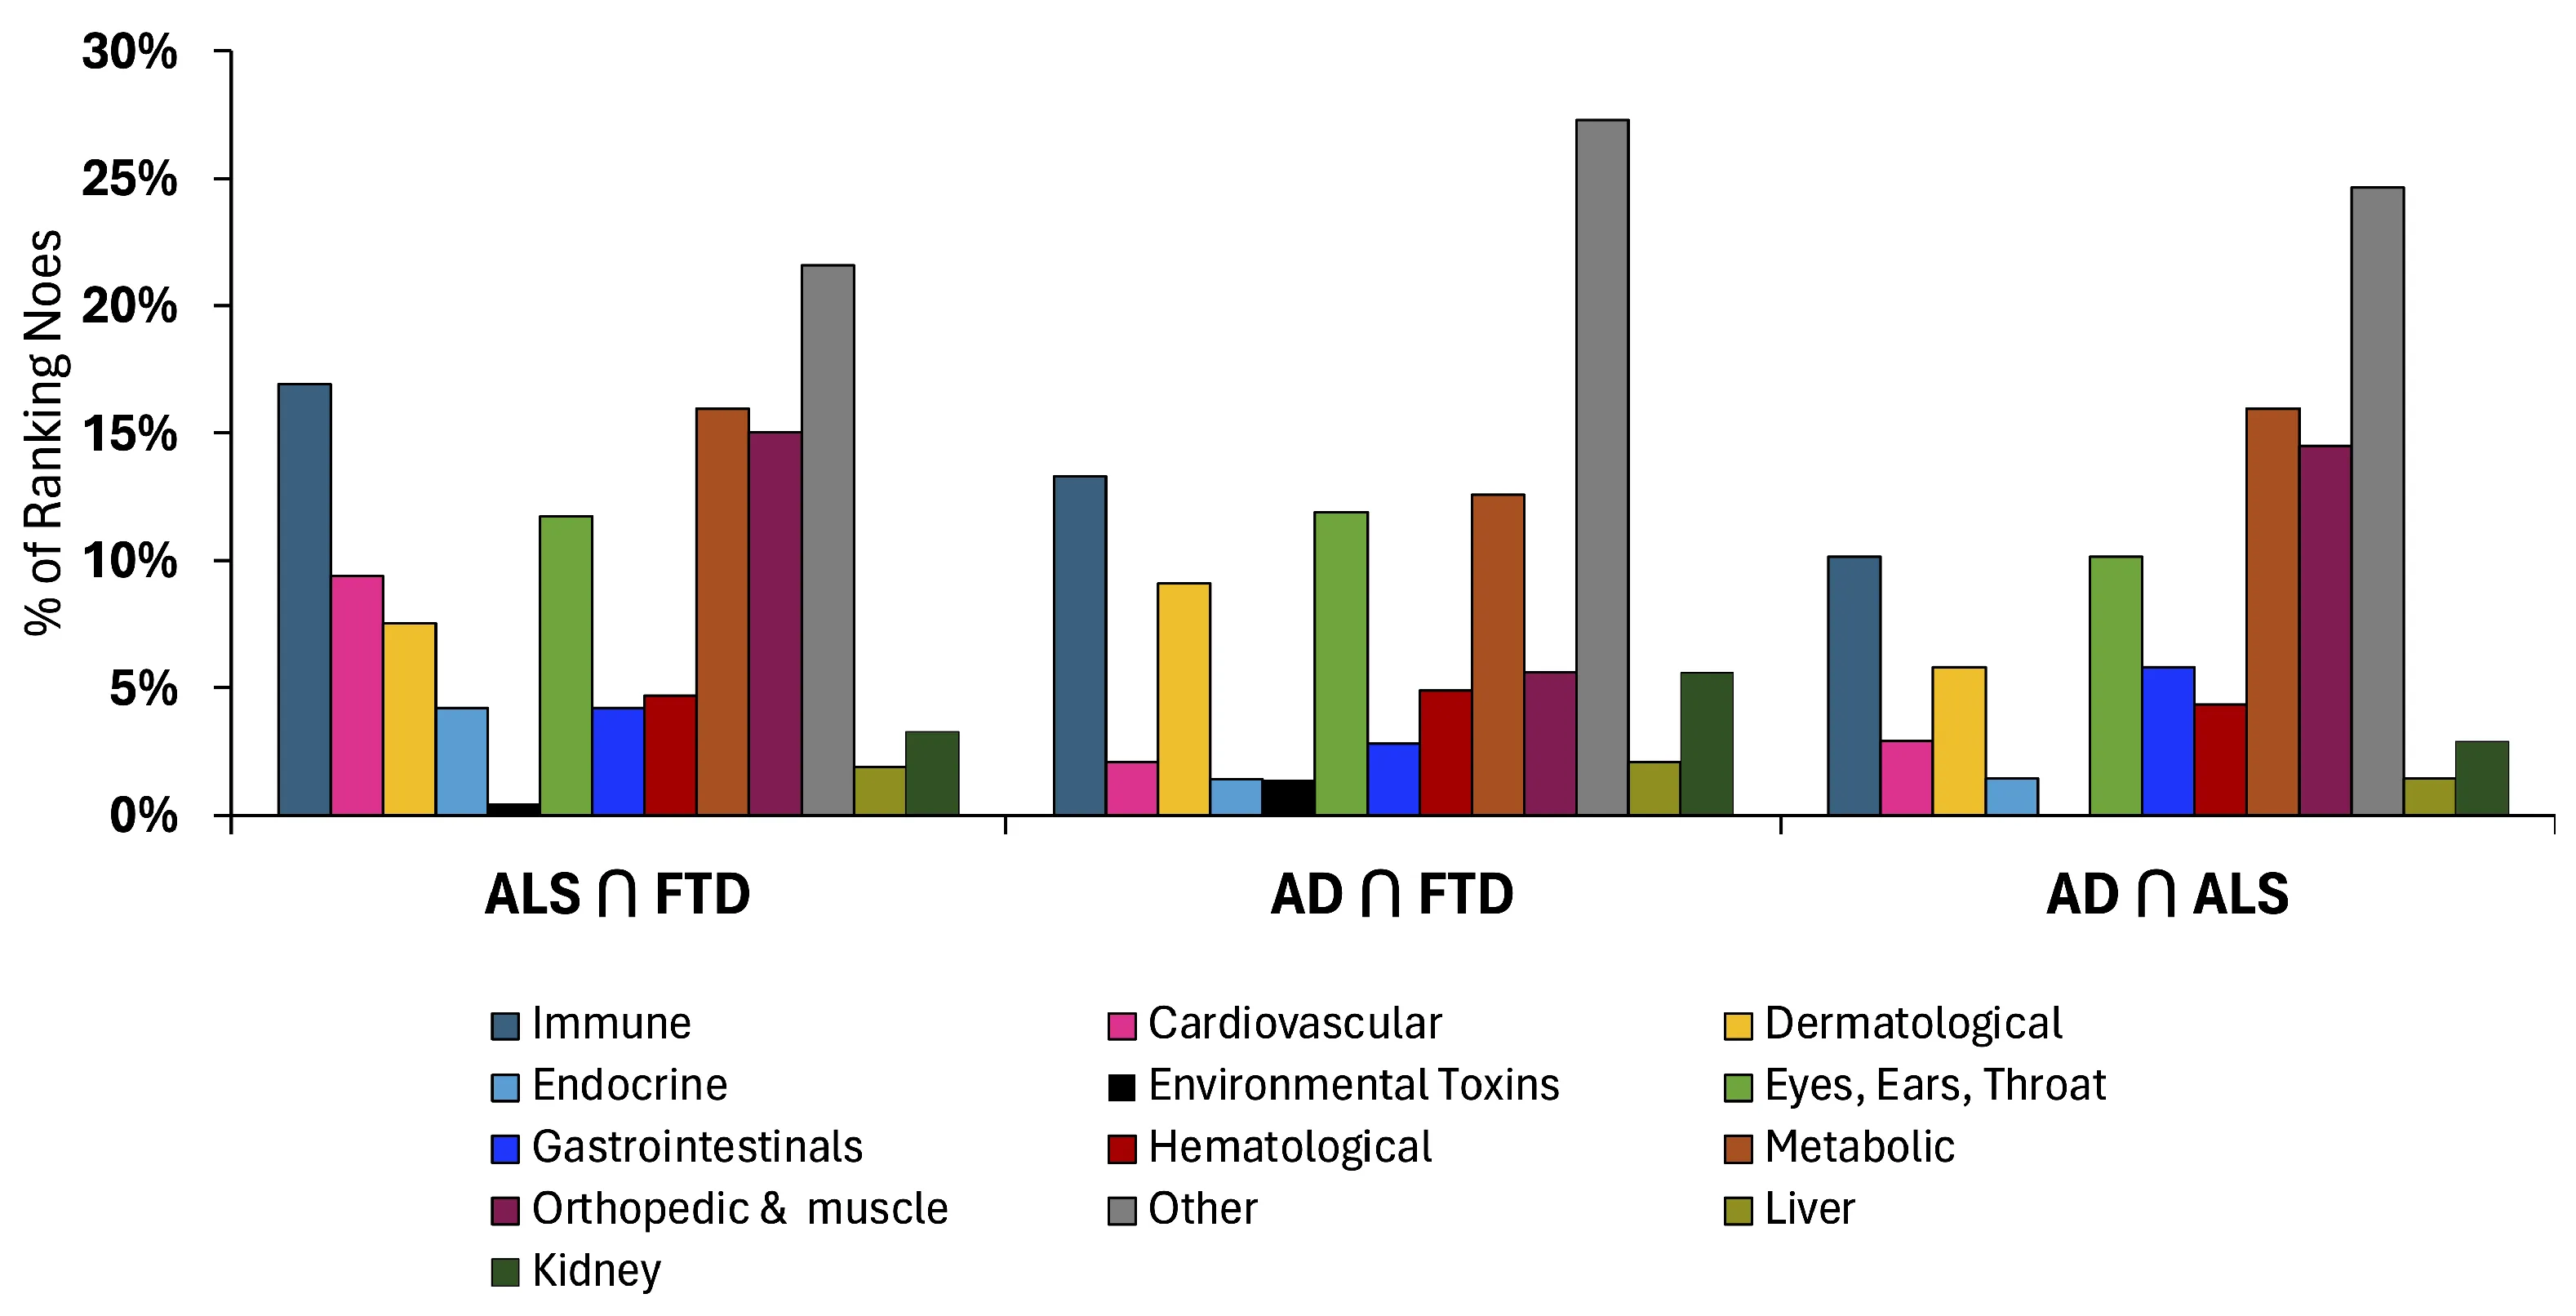
- Compared high-ranking disease concepts across disease pairs and organized them into 13 mechanistic categories. Three human evaluators reviewed high-importance category assignments, with reported agreement of κ = 0.88.
Key findings
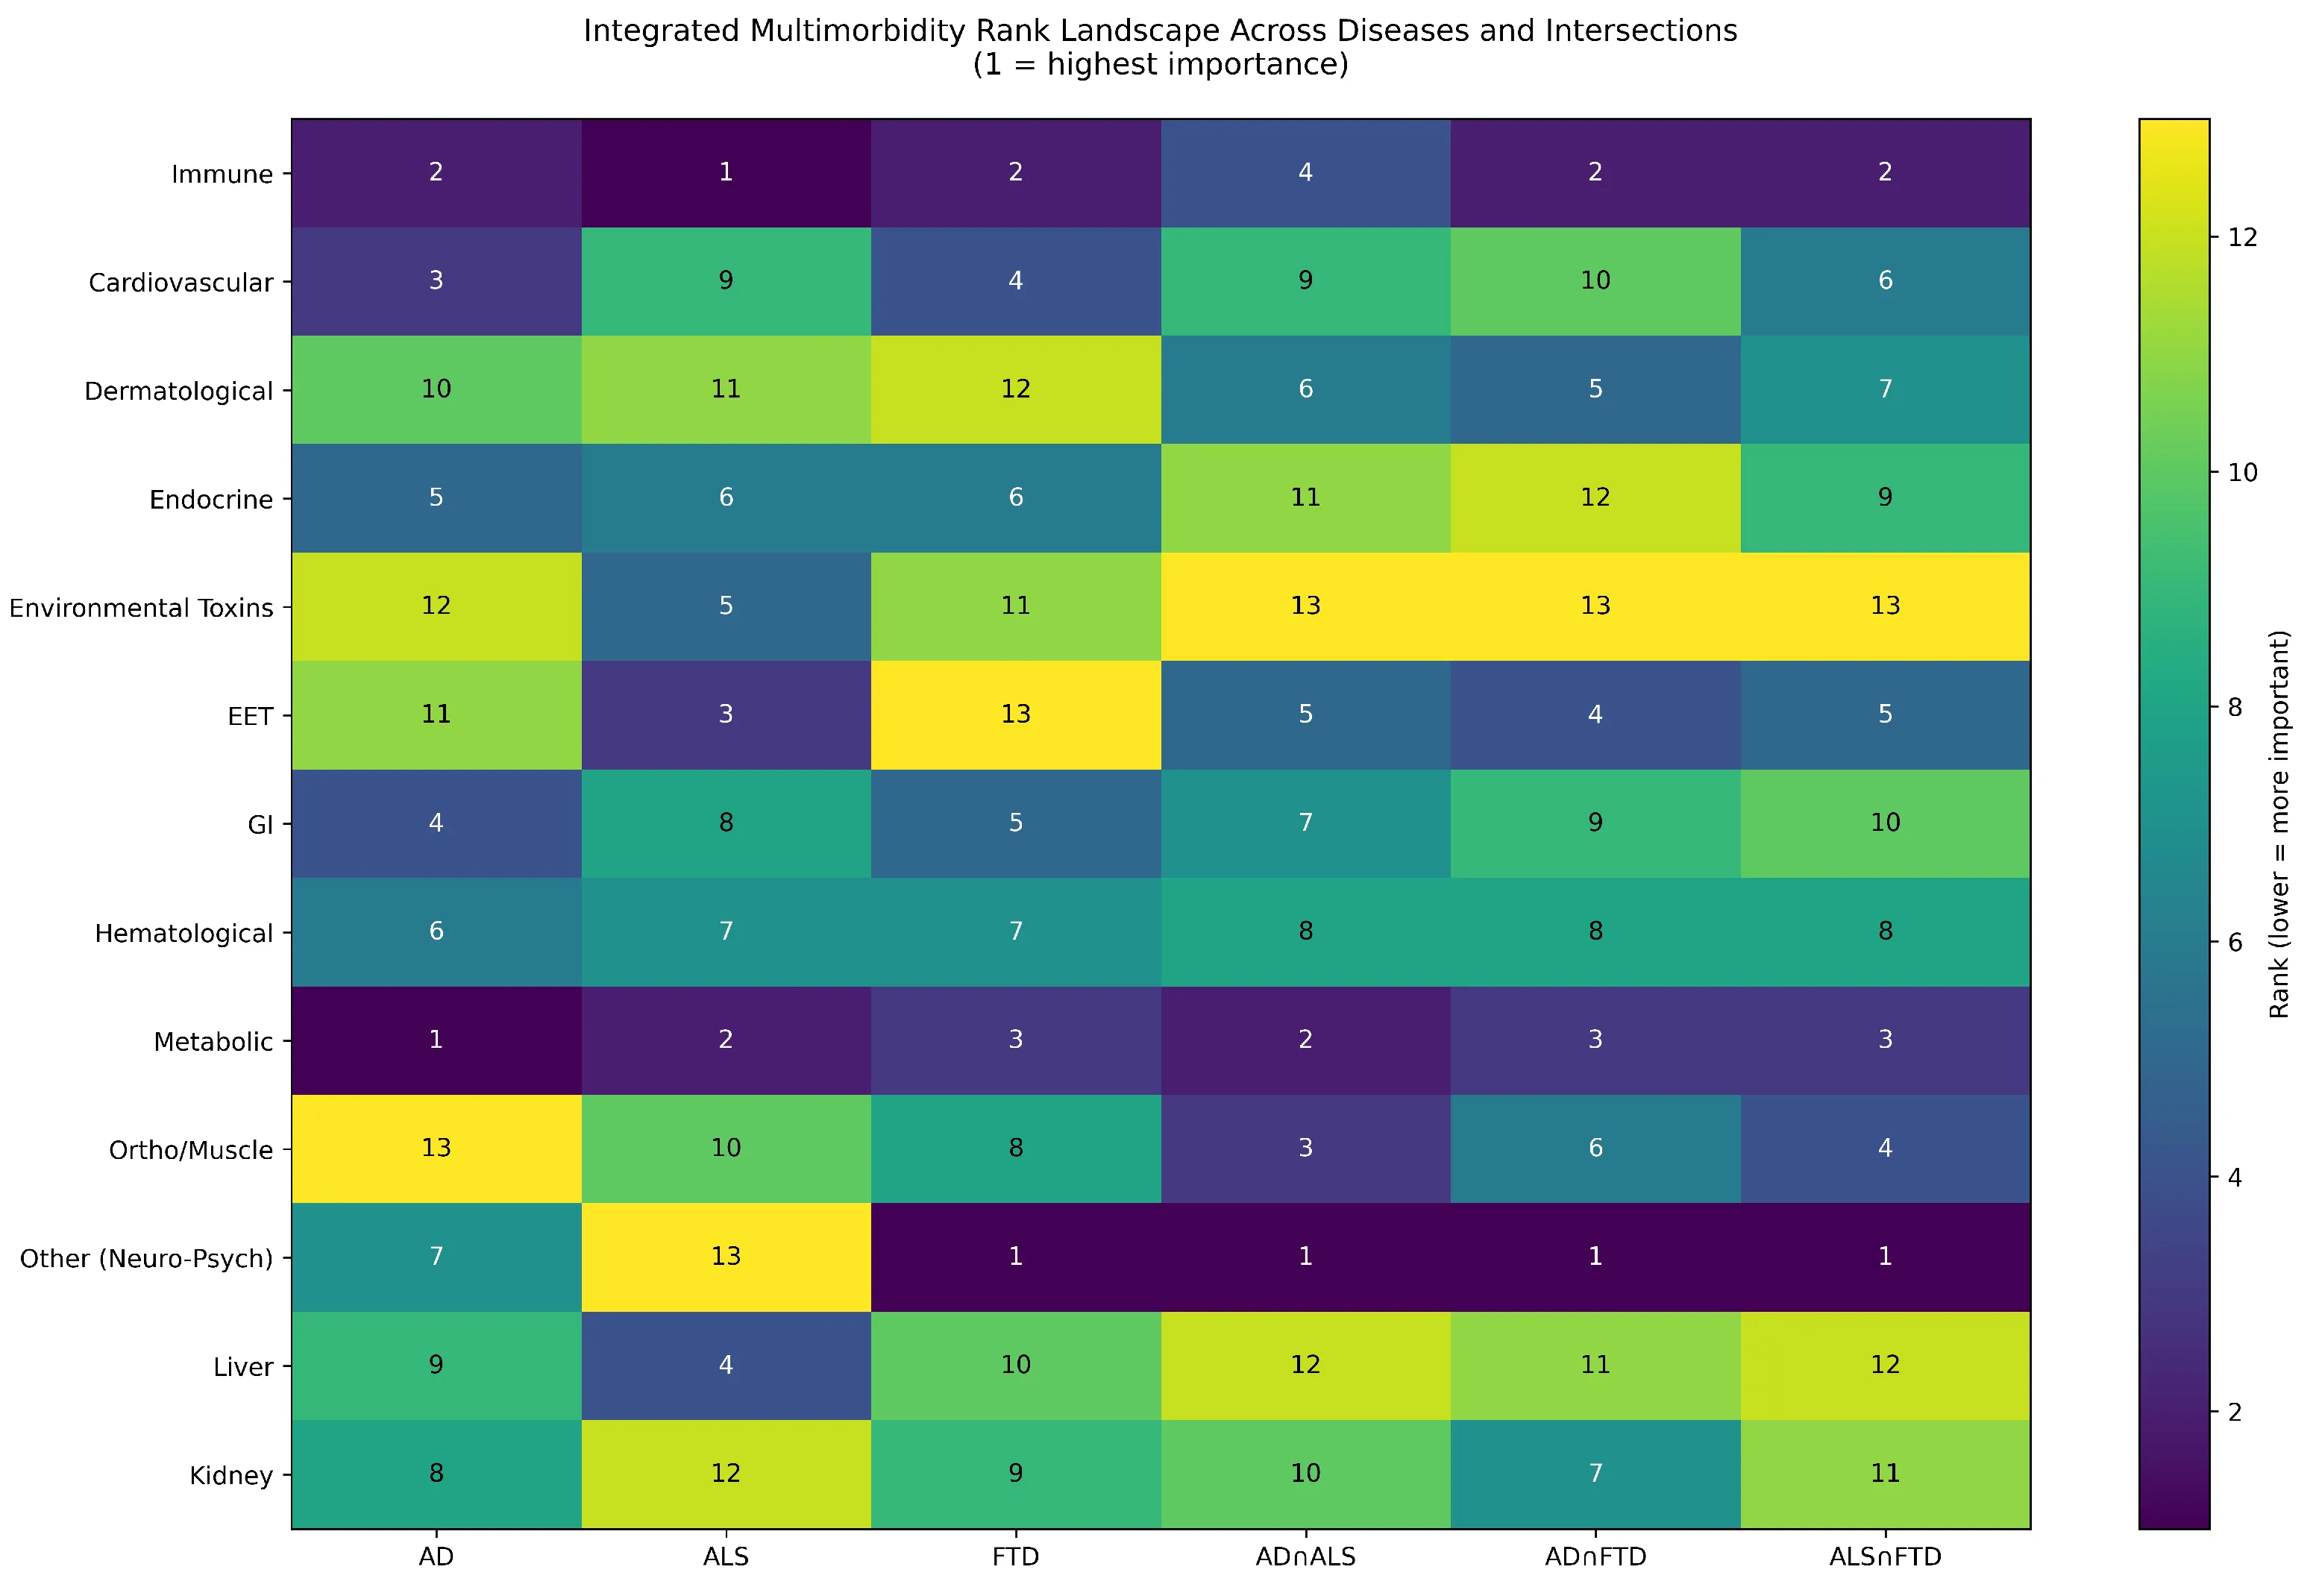
- The literature-derived analysis suggested a shared metabolic and immune/inflammatory core across the three diseases.
- Cardiovascular categories were comparatively prominent for Alzheimer’s disease, while environmental-toxin and neuromuscular categories stood out for ALS.
- These associations generate hypotheses rather than establish causation or clinical comorbidity rates. Some neuropsychiatric concepts may reflect disease-related symptoms rather than independent conditions.
Figures